miércoles, 8 de junio de 2016

Bending material report

Research question:
How the different weights above a ruler can affect its bending?


Introduction:
My investigation is related with cranes as the cranes need to be made of materials that resist big amounts of weight and move it with out without breaking. My experiment will explain why the weight affect the bending of a material, in my case, a ruler. To explain why the ruler bends when we put weight we must explain why the force of gravity makes the weight go down and how does that affect if force.
If a body is near a planet, there will be an acceleration of that object directed to the central area of that planet. This is not possible if there are other forces affect them. In the earth, the acceleration of the gravity is  9.81 m/s². To know the force of the different weight we must use the formula Force=Mass x Acceleration, the unit of force is Newton, the unit for mass is kg and the unit for acceleration is m/s². We know that, for example, the first one won´t have mass so 0 x 9,81 m/s² is equal to 0 N. If we use second one the force will be 0,25 x 9,81 m/s², this is equal to 2.45 N. (Anonymous, 2016) 
To explain why the ruler bend we should know some concepts. the ruler a solid material and it molecules are in ordered structures. The important point is that depending on the materials there are different types of flexibility, flexibility is the capacity of an object to bend without breaking. ("Definition of FLEXIBLE", 2016) For example, cranes are made of metal because it is very resistant and it isn't very flexible so it can bear a lot of weight easily. The plastic, instead, is very flexible and can bend easily. The ruler is a made off very resistant material although it is very flexible so it is perfect for the experiment.


Hypothesis:
From my point of view, the ruler that will bend the less will be the first one as it don´t have any weight on the end, this is because it will have the lowest force. The fifth ruler will be the one that will bend more as it will be the one with more weight so it will have the highest force and the ruler will bend more than the others.


Variables:
- The independent variable will be the weight that is on the end of the ruler. This is because I will manipulate it by changing the amount of weight in each ruler. This will affect directly the bending of the ruler. I will measure it with a balance. In the first ruler I won't put any weight. In the second ruler I will put 100 grams. In the third one I will put 200 grams. In the fourth ruler I will put 300 grams. Finally, in the last ruler I will put 400 grams of weight.
- The dependent variable will be the bending of the ruler. This is because it depend on the amount of weight that is on it end. I will measure it with a rule, I will measure the distance from the top of the table to the lowest part of the ruler when it is bent.
-The controlled variable will be the amount of ruler that will be fixed to the table, 15 centimeters, I will measure it with a ruler. Also a controlled variable will the position of the different weights on the end of the ruler, all 2 cm of the border, I will also measure it with a ruler. Another controlled variable will be the temperature. This is important as the temperature can affect the bending of a material. All of them are controlled variables because they are always the same quantity and they don't affect the other two variables.


Materials:


-Different weights
32829626.jpg
-5 Rules
ruler-150936_640.png
-Stopwatch
461685595_096.jpg
-Tape
cinta-adhesiva-fiso-embalaje-color-marron-50mm-x-66m-6379829z0-00000067.jpg
Method:


  1. First of all, I will prepare all the material on a table, t . Then I will fix  with tape the first 5 cm of the first ruler to the table in a way that it don´t moves.
  2. Secondly, I will put the corresponding weight on the end of the ruler, in this case 0 grams.
  3. Thirdly, I measure the distance from the top of the table to the lowest part of the ruler. I will put the results in a table. I will do 2 more trials to have an average.
  4. Then I will repeat the process with the other four puting the results in the table.
  5. Using the data that we have collected in the step 3 and 4 we will do a clean table and a graph in excel.

Table and graph:
Relation between the mass on the ruler and the distance it bends (cm).


 Mass (g)
Trial 1
Trial 2
Trial 3
Average
DESVEST
0
0,0
0,0
0,0
0,0
0,000000
100
3,0
3,5
3,5
3,3
0,235702
200
4,5
5,0
5,5
5,0
0,408248
300
7,0
8,0
8,0
7,7
0,471405
400
9,5
9,5
10,0
9,7
0,235702


Conclusion:
Firstly, we can see that there values between the amount of mass and the centimetres displaced by the rulers are directly proportional, this means that when we put more mass to the ruler, the centimetres displaced by it will also increase. By this we know that the mass is the indirectly proportional value and the centimetres displaced is the directly proportional value as the centimetres displaced depends on the mass and the mass doesn't depends on other variable. For example, we can see in the table that with 100 grams, the average centimetres displaced are 3,3 while with 200 grams, the average centimetres displaced are 5. Also, because of the shape of the graph we see that the difference between the values is nearly always the same and that the graph is increasing.

Evaluation of the method:
The first error that we found was that as we were always touching the rulers, the rulers had a different position. Before starting with a new weight we put correctly the ruler but during the trials inadvertently we could have moved them a little. This is a very important factor because a slightly difference of position can affect the final result as it obtains more or less velocity. This is an example of random error as it is caused by unpredictable changes in the equipment or conditions of the experiment. It can be solved by fixing the rulers to the table with adhesive tape to avoid it movement.

The second error that we found was that when we put the weights on the ruler we did not put them at the same distance from the end. This is a serious error as it could affect the bending of the ruler so it affects the final result. This an example of random error as this error is caused by unpredictable changes in the equipment of the experiment. It can be solved by using a ruler before we put the weight.

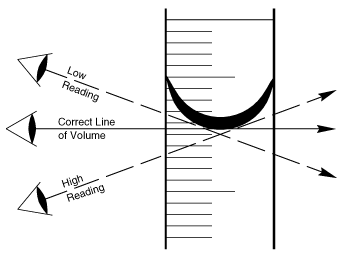
The third error that we found was that when we were measuring the bending of the ruler we did not read correctly the measurements of the ruler and we did not collect exactly the distance the rule has doubled. This is an example of a parallax it is caused mainly by seeing the object at an oblique angle so we think that a way to solve this error is to observe the ruler with an angle of 0º so we always collect the data correctly.
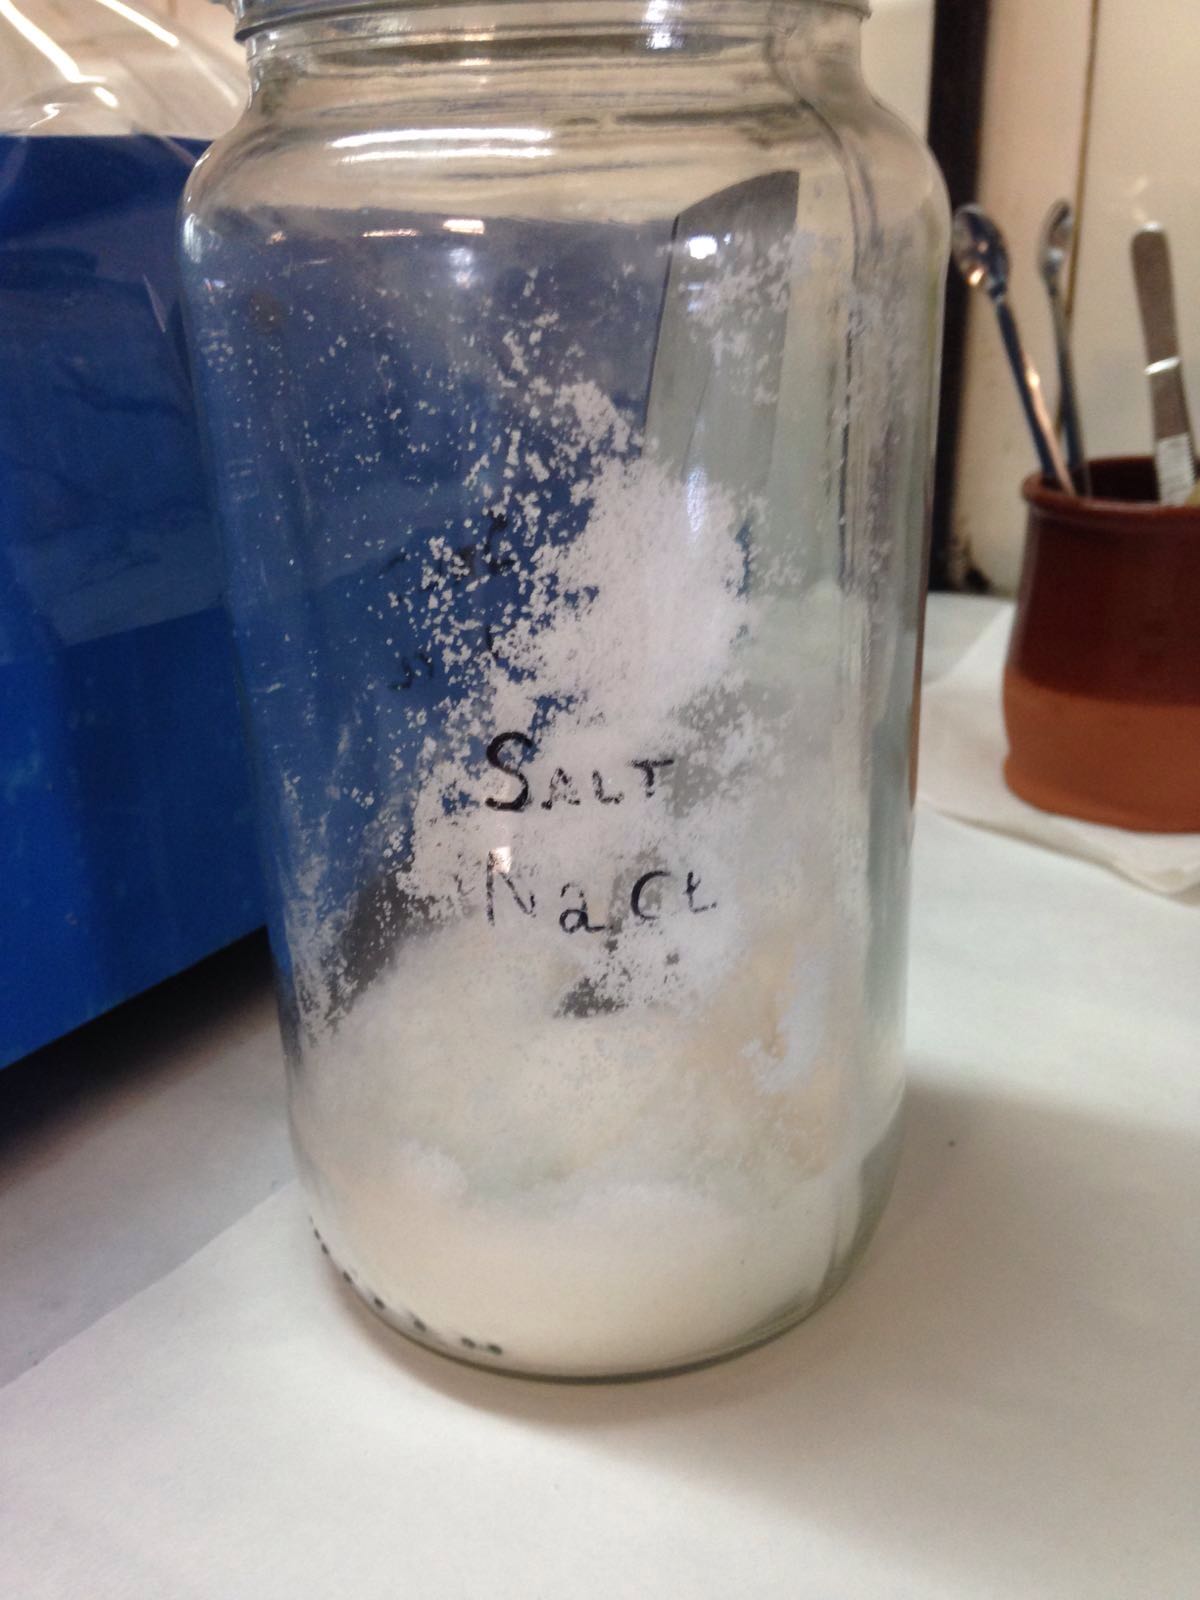
Photos
 Firstly we join the different weights we are going to use and we fix them with sellotape.

We prepare the rules

Then we put the different eight above the rules and measure the distance it bends.


References:


  • (2016). Retrieved 9 March 2016, from http://whatis.techtarget.com/definition/gravity-or-gravitationç
  • Definition of FLEXIBLE. (2016). Merriam-webster.com. Retrieved 9 March 2016, from http://www.merriam-webster.com/dictionary/flexible
  • Flexibility and toughness. (2016). Senze-instruments.com. Retrieved 16 March 2016, from http://www.senze-instruments.com/flexibility_and_toughness.html
  • Free Standing Cranes Bring You Flexibility | EMH, Inc.. (2016). Emhcranes.com. Retrieved 11 April 2016, from http://www.emhcranes.com/free-standing-cranes-bring-you-flexibility/
  • Gravitational Force: Definition, Equation & Examples - Video & Lesson Transcript | Study.com. (2016). Study.com. Retrieved 11 April 2016, from http://study.com/academy/lesson/gravitational-force-definition-equation-examples.html

lunes, 25 de abril de 2016

Lab Session 8 - UARM

Objective:

Determine the acceleration of an object falling along an inclined plane by different methods.


Table with the relation between distance and time:


Conclusion:
The three graphs went like it said in the background information, as the results all of them are ascending through the graph.
The first graph that is comparing the distance travelled of the marble and the time that the marble last to cover the distance, we can see that both values are directly proportional and that is why it has that shape. The shape of the graph seems reasonable as when the distance is bigger, the marble will last more time to reach the point.
As seemed, the graph that compares the distance and the squared time is very similar to the first one, as it compares the same variables (distance and time), but this time the graph has more gradient as the time is square. And as it's squared, the values are bigger. We could also say that both values of the second graph present also directly proportional values as when the distance increases, the time squared increases too.
Thirdly, the last table present a comparison between the velocity of the marble and the time. This graph is like the other previous graphs, when talking about it shape (ascending, like the other two) and the values (directly proportional, like the other two, as when velocity increases, the time increases too). We could say that the three graphs went how it was supposed so the experiment was well done.
Finally, it is important to say that the acceleration should be the same always as it shouldn't change, but it changes in some values in the data because of some errors that will be explained in the evaluation of the method.

Evaluation of the method:
The first error that we founded is that when we were doing the third trial in the 1 meter and a half distance we slightly push the marble when we drop it. This caused that the marble went faster than in the other 2 trials and affect directly in the average. This is an example of a human error that could affect the final result. To solve this error we must try to be more careful and in the case that this incident is repeated we must have to do it again.
The second error that we founded was that when we stopped the chronometer in each trial we did it when the marble was few millimetres further from the mark. So when the chronometer stops, the marble had cover more distance that it should. The distance was not exactly as we planned and that could affect the final result. This is a systematic error as it arise from a problem in the experimental setup that results in the measured values always deviating from the “true” value in the same direction. This is a derivation of the parallax error as it is caused mainly by seeing the object at an oblique angle so we think that a way to solve this error is to stop with the hand the marble exactly in the mark.
The third error that we founded was that, as the experiment was long and we were always touching the aluminium rails, the aluminium rails had a different slant. Before starting with a new distance we put correctly the aluminium rails but during the trials inadvertently we could have moved them a little. This is a very important factor because a slightly difference of slant can affect the final result as it obtains more or less velocity. This is an example of random error as it is caused by unpredictable changes in the equipment or conditions of the experiment. It can be solved by fixing the aluminium rails to the wood pieces with adhesive tape to avoid it movement.


Photos of the procedure:

Materials:

Aluminium rails
Marble
Ruler
Wood pieces

Process:
1)Put the rail over the wood pieces with some angle.
2) Make five marks regularly spaced on the rail.
3) Measure with the meter the distances from the start to the marks.
 4) Drop the marbles from the start and measure the time they last to the marks. Repeat the measurements at least three times from the start.


sábado, 27 de febrero de 2016

Evaporation experiment

Design an investigation on a factor that could affect to the evaporation rate of a substance
Research Question
How different amounts of dissolved table salt can affect the evaporation of water at the same temperature?


Introduction
Evaporation is the process by which different atoms or molecules in a liquid obtain enough energy to become a gas and change the substance of state. The molecules thermal motion must be enough to reach the liquid surface tension caused by IMF’s in order for the liquid (in this case water) to evaporate, in other words, the liquid kinetic energy must overtake the surface function of attachment. So evaporation happens quicker with liquids with a lower surface tension at a higher temperature. The rate of evaporation is limited because only a small amount of the molecules are placed near the liquid surface and furthermore, a smaller amount of them are moving in the correct way. In addition, the remaining molecules have lower average kinetic energy as the liquid fastest molecules had escape, and, because of this, the temperature of the liquid decreases.


When evaporation occurs in a closed container, the escaping molecules assemble together as a vapour above the liquid. Many of this escaping molecules then return to the liquid and they become as returning molecules more common as the density and pressure of the vapour substance increases. When this process of the molecules of escaping and returning from the liquid reaches its equilibrium, the vapour is saturated. (Chemguide.co.uk, 2016)(Projects.icbse.com, 2010)


Factors that influence the rate of evaporation
1.     Temperature of the substance. The evaporation will be faster if the substance is hotter.
2.      Intermolecular forces. The stronger the forces keeping the molecules together, more energy is needed in order to evaporate the liquid.
3.        Surface area and temperature.
Surface area and temperature
Molecules or atoms evaporate from the surface of the liquid, when the surface area is larger, it allows more molecules or atoms to go from the liquid to the air becoming vapour, and because of this, evaporation happens quicker.


The higher and hotter the temperature is, the higher the rate of evaporation is. When the temperature is hotter, the molecules and atoms move with more speed, and because they are quicker, more particles are able to leave the liquid's surface.

Intermolecular forces
Most liquids are made up of molecules. The attractions between the molecules increase because normally, the molecules have a region with a slight negative charge, and other one with a slight positive charge. These different regions of electric charges are created because some atoms of the molecules are more electronegative than others. For example, in water, the oxygen atom is more electronegative and the hydrogen is less electronegative, or more electropositive. Water molecules are attracted all together because the positively charged hydrogen atoms are attracted with the lone pairs of electrons of the negatively charged oxygen between different molecules.


The intermolecular forces attractions between molecules affect the evaporation rate of a liquid because strong intermolecular forces attractions need more energy to separate them as they are all hold together in the liquid. Because of this, liquids with stronger intermolecular forces between the molecules evaporate slower than liquids with weaker intermolecular forces between the molecules.
(Projects.icbse.com, 2010)


Salinity of water and it boiling point
When we add salt to water, this makes take longer for the water solution to boil. The table salt really increases water boiling point.

When salt is added to the water, the phenomenon of boiling point elevation does it effect. Boiling point elevation only happen when a non volatile solute (in this case table salt) is added to a pure solvent (in this case water) creating a solution (in this case salt water).

Saltwater needs more temperature in order to start evaporating and also in order to boil than pure water alone. So with this phenomenon, when we add table salt to water, the boiling and evaporating point increases and, furthermore, the time the solution takes to boil and evaporate increases. Concluding, the evaporation is slower because the sodium and chlorine ions take up space on the surface of the liquid so that less water molecules can turn into a gas.
(Mental Floss, 2015)
Hypothesis
In my experiment, I'll put 0,2 litres (200 ml) in 5 beakers, all with the same amount of water. Then, I will add to the beakers 5 different amounts of table salt: 1st 0 grams of table salt, 2nd 10 grams, 3rd 20 grams, 4th 30 grams and 5th 40 grams. They will be heated all at the same temperature, 90 degrees, and they will be the same time heated in the water bath (10 minutes). I think that more water solution will evaporate in the 1st beaker and less water solution will evaporate in the 5th beaker because water evaporates faster without salt as the boiling point of water increases when adding more salt. And this is because when we add salt, the sodium and chlorine ions take up space on the surface of the liquid and they block the water molecules to turn into a gas, so when more salt is added, more sodium and chlorine ions take up in the surface of the liquid blocking the water molecules to pass. In other words, the solution boiling point is directly proportional to the amount of salt added.
Variables
- Independent: The independent variable is table salt, I will manipulate it by changing the amount to table salt in each trial, this will affect the solution boiling point, the amount of water evaporated. I will measure the amounts of table salt with a balance.
- Dependent: The dependent variable is the amount of water evaporated at the end of the experiment. I will measure the amount of water evaporated in ml, I will do the different from the initial solution with the final solution, and then the difference is the amount of water that has been evaporated in ml. To do this, I will use a beaker to see and measure the solution at the start of the experiment and at the end of the experiment.
- Controlled: The controlled variable is the water that I put to the solution, the container where the solution will be in, that it will be a beaker, and the temperature at which the solution will be exposed, that is 90 degrees. I will use a beaker to measure the amount of water too. All of them are controlled variables because in the experiment they are always the same quantity and they don't affect the other variables (dependent and independent).
Materials
- 5 beakers of 500ml each.
- Water (H2O) 200 ml in each beaker, and also some water for the water bath.
- 100 grams of table salt (10+20+30+40 = 100 grams).
- A balance (to weight the exact amount of table salt).
- A water bath (to heat up water).
- A stopwatch (to control that the beaker is being heated the exact amount of time).
Method
  1. We put 200 ml of water in each of the 5 beakers.
  2. We add the exact amount of table salt, different each trial, to the water forming a solution (1st beaker 0 grams, 2nd 10 grams, 3rd 20 grams, 4th 30 grams and 5th 40 grams). I will stir the solution to make sure that the salt has dissolved totally.
  3. We add water to the water bath and we wait until the water reaches the precise temperature and is at 90 degrees, we will measure it with a thermometer.
  4. We put the beaker with the solution in the hot water that is in the water bath for 10 minutes.
  5. We measure the solution dissolved using the beaker to collect the data.
  6. We do step 4th and 5th with each beaker.
  7. We do the experiment three trials to be more precise.
  8. Once we’ve collected all the data, we make a table and a graph with the data to study the results of the experiment.
  9. Finally, we do a conclusion and an evaluation of the method with the results explaining what we’ve studied and the conclusions we’ve got, and also we say the problems that happened while we were doing the experiment and how we solve them.
Results

Table with the difference of milliliters from the initial volume


Difference of ml from the initial volume

Grams salt
trial 1
trial 2
trial 3
average
SD
0
5,0
6,0
4,0
5,0
0,8
10
3,0
4,0
3,0
3,5
0,5
20
2,0
3,0
2,0
2,3
0,5
30
1,0
1,0
2,0
1,3
0,5
40
0,0
1,0
1,0
0,6
0,5


Revision of the method
  • The first error that we founded was that when we add the water inside the pipe we did not read correctly the measurements of the pipe so when we put after the water in the beakers there wasn't exactly 200 milliliters in each one. The concentration was not exactly as we planed and that could affect the final result. It is a systematic error as it arise from a problem in the experimental setup that results in the measured values always deviating from the “true” value in the same direction . This is an example of a parallax it is caused mainly by seeing the object at an oblique angle so we think that a way to solve this error is to observe the pipet with an angle of 0º. (Department of Natural Sciences, 2016)
  • The second error that we founded was that the balance were we measured the mass of salt could be incorrectly calibrated and it always give us a slightly higher reading that it should. It is a calibration error.  It is a systematic error as it arise from a problem in the experimental setup. This error is important because it could affect the final result of the experiment as the concentration of salt was the independent variable and if affects directly the dependent variable.
  • The third and final error that we founded was that the temperature of the water bath wasn't the same in all the trials because when we put the beakers inside the water bath the temperature was not exactly 90 degrees, it had a lower temperature because the beakers were cold and because the external temperature. This could made that the temperature varies so there wasn't the same temperature in all the trials, this could affect the final result. This is an example of  a systematic error as the temperature always is the same or lower than we expected.


Conclusion
Concluding, from the results we could say that the experiment went relatively good as the results were as we thought and wrote in the hypothesis, where the beaker with less amount of table salt dissolved (0 grams) was the beaker in which more water was evaporated and the beaker with more amount of table salt dissolved (40 grams) was the beaker in which less water was evaporated. From this, we could come to the conclusion that the amount of table salt dissolved in the water is inversely proportional to the amount of water solution evaporated, as expected. Also, we can see that the graph has a descending of the results and that the points of the results don’t vary so much from the trend line so this means that the results of the experiment are well represented in the graph, as it’s a constant descend. Although the results vary a bit because of the temperature and the time weren’t exactly the same and were some factors that could alter the results, they don’t vary so much and that can be seen in the standard deviation that it’s constant with all the beakers during the three trials.
Finally, even though we had to come through some difficulties during the experiment, as the change of the amount of table salt, temperature and water, the concept of the experiment was always the same and finally we passed this difficulties well and we could finish the experiment with the results and the conclusions we expected.


Photos of the experiment


Materials:

Salt
IMG-20160226-WA0002.jpg
Water bath
IMG-20160226-WA0004.jpg
Pipe, water, 3 beakers
DSC_0005_3.JPG
Balance
IMG-20160226-WA0003.jpg
1. Put 200 milliliters of water in each beaker:
DSC_0004_2.JPG
2. Add the salt that we measured in the balance to the beakers and churn the solution:
IMG-20160226-WA0001.jpg
3. Measure the temperature of the water bath until it is at 90º:
IMG-20160226-WA0000.jpg

4. Put the beakers inside the water bath and wait 10 minutes, then put out the beakers and then measure the difference of volume from the initial volume:
IMG-20160226-WA0005.jpg


References
ºº1º1Chemguide.co.uk,. (2015). Raoult's Law and non-volatile solutes. Retrieved 4 November 2015, from http://www.chemguide.co.uk/physical/phaseeqia/raoultnonvol.html
Google Books,. (2015). Applied Thermodynamics. Retrieved 4 November 2015, from https://books.google.com/books?id=SPAo9at6v-QC&pg=PA407&lpg=PA407&dq=Henery%27s+Law&source=bl&ots=O2hQAQbsd2&sig=yf0l8_zGn_vjL36hClaocw_HmBY&hl=es&sa=X&ved=0CCsQ6AEwAmoVChMIhIO3q_L0yAIVEPFjCh3C5AKZ#v=onepage&q=Henery's%20Law&f=false
Madsci.org,. (2015). Re: How does salt affect evaporation?. Retrieved 4 November 2015, from http://www.madsci.org/posts/archives/1999-11/941723614.Ch.r.html
Mental Floss,. (2015). Does Adding Salt to Water Make It Boil Sooner?. Retrieved 4 November 2015, from http://mentalfloss.com/article/60046/does-adding-salt-water-make-it-boil-sooner
Projects.icbse.com,. (2010). CBSE Projects Chemistry, C++, Physics, Maths, Biology, IP, Disaster Management. Retrieved 4 November 2015, from http://projects.icbse.com/chemistry-258