- Find out the reaction that takes place between the reactants and explain what happens in the reaction.
Table with the realation in the stoichiometry of a reaction
milliliters
|
centimeters
|
|||||
Vol k2CrO4
|
Vol BaCl2
|
Height 1
|
Height 2
|
Height 3
|
Average
|
SD
|
0,5
|
4,5
|
0,7
|
0,5
|
0,5
|
0,6
|
0,1
|
1,0
|
4,0
|
1,0
|
0,7
|
0,8
|
0,8
|
0,1
|
1,5
|
3,5
|
1,3
|
0,8
|
0,9
|
1,0
|
0,2
|
2,0
|
3,0
|
1,6
|
1,1
|
1,0
|
1,2
|
0,3
|
2,5
|
2,5
|
1,8
|
1,3
|
1,5
|
1,5
|
0,2
|
3,0
|
2,0
|
1,9
|
1,4
|
1,4
|
1,6
|
0,2
|
3,5
|
1,5
|
1,8
|
1,3
|
1,3
|
1,5
|
0,2
|
4,0
|
1,0
|
1,7
|
0,7
|
1,3
|
1,2
|
0,4
|
4,5
|
0,5
|
1,5
|
0,5
|
0,9
|
1,0
|
0,4
|

Conclusion
First of all, we have to describe the
shape of the graph of the results, we see that at the beginning, the graph
increases and that at the middle, there is a turning point in which the graph
starts decreasing. This is because the highest point is the point in which
there are more or less the same amount of BaCl2 and K2CrO4, that is in the
middle of the graph, and then, the height is less in the extremes of the graph
as there is more difference between both substances, this is because of the
molecules produced due to the molar ratio. The graph shows the relation in
stoichiometry between the height of the solute and the amount of BaCl2 on each
solution, and there is a variation on this relation, as we explained before. At
the beginning, we see that the error bars are higher and while they pass
through each point of the graph, it decreases. This could be because we've
represented bad the results or because we've measured them better in the last
solutions than in the first of them. The results show that the stoichiometry is
1:1 for the reactants (Wpi.edu, 2016) as the results and the graph starts from
a point, then it increases, and then at a turning point (where the ml of both
substances are the same for the solution) it starts decreasing until it reaches
approximately the initial point. So this shows that is more or less the same
when it's seen from one extreme and from the other. This is because of the
molar ratio as the values of BaCl2 start including 0,5 ml and they end including
in the solution 4,5 ml, and the values of K2CrO4 the other way around,
including in the solution at the start 4,5 ml and at the end 0,5 ml. What I've
just said is the explanation to the varies of the results. The turning point in
the graph is when we've included in the solution 2,5 ml of BaCl2 and K2CrO4.
Evaluation
 -First of all, we founded an error at the first part of the experiment, when we put the potassium chromate inside the pipet we didn´t read correctly the measurements of the pipet so when we put the substance inside the diferent tubes the diference wasn´t exactly of 0,5 ml of potassium chromate. We found the same problem with the barium chloride because we used the same process to put it inside the tube with the potassium chromate. The concentration wasn´t as we planned and that could affect the final result. This is example of a parallax error so it is a systematic error because the error arise from a problem in the experimental error. Parallax error is caused mainly by seeing the object at an oblique angle so we think that to solve it we must observe the pipet with an angle of 0º.
-Another error that we found was that when we measured the height of the solid, the solid in the different tubes wasn´t heaped in the same way, in some cases the solid was mostly at the end of the tube and only a few amount higher. In other cases only a litle amount of the solid was at the bottom of the tube while mostly of the solid was above. This is a big problem as it does'nt show accurate results. This an example of another systematic error as the rror arise from a problem in the experimental error. To solve this complex error, We would put the liquid of the tubes in another clean tube leaving the solid in the other tube, assuming that in each tube there was 5 ml the amount of solid will be the 5 ml less the amount of liquid in the other tube.
- One of the main error that we found in the experiment was that we were shaking the tubes with the solution puting our fingers above the tube. This is a very rudimentary way to shake the tubes. Also not all the tubes were shaked in the same way and in the same amount of time and were are not sure that the chemicals had reacted together in the same way. This is random error as all tubes were shaked during a different amount of time. This is a error that we should try to solve. We think that the best way to solve it will be to reverse the tubes 10 times in 10 seconds, 1 per second. We will measure it with a chronometer.
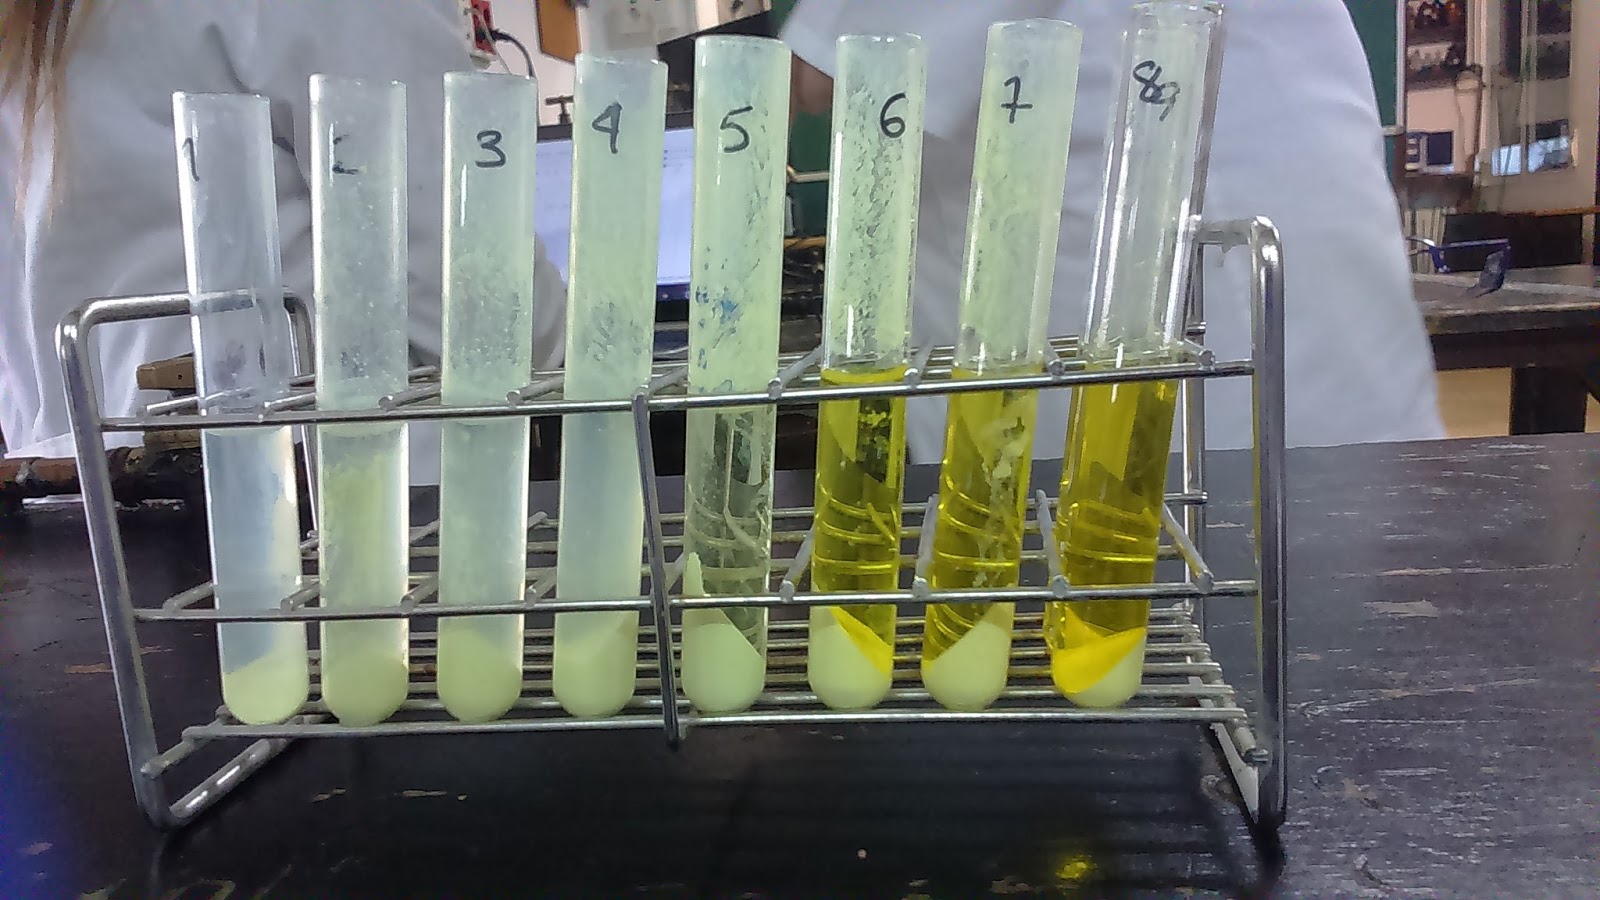
Photos of the procedure
Materials

Using the pipette, put 0.5 mL of potassium chromate in the first tube, 1.0 mL in the second, and so on up to the ninth.


Again using the pipette, put 4.5 mL of barium chloride in the first tube, 4.0 mL in the second, and so on up to the ninth, so that the final volume in each tube is 5.0 mL.


Mix well the content of the tubes inverting them a couple of times.

Use the centrifuge to settle the solid to the bottom of the test tube.


Take a photo of the rack and measure the height of the solid in each tube.
References
Wpi.edu,. (2016). Job's Method for Determination of Stoichiometry. Retrieved 26 January 2016,